- Other names are AB testing, Confirmative Analysis, and significance testing.
- Generally, population parameters (standard deviation, maximum, minimum, and so on) are unknown in real-time.
- However, we do have hypotheses about what the true values are.
- Hypothesis testing is a bunch of methods to evaluate the hypothesis about the population parameter based on the available sample parameters.
- There are 2 terms in the hypothesis, they are null hypothesis and alternate hypothesis.
Null Hypothesis (H0):
- A general statement about the population parameters which assumed to be true unless strong proof for the opposite statement.
- The default statement is that there is no difference between the measured phenomenon, there is an association among groups.
Alternate Hypothesis (H1 or Ha):
- Just the opposite of the null hypothesis.
- the default statement is that there is a difference between the groups.
Testing types:
T-Test
Also called Student’s T-Test. If the sample size is less than 30 and the population variance is unknown we should use a t-test.
- Paired sample T-Test (Dependant T-Test)
One-Sample T-Test:
- To check whether the mean of the population is significantly different from the sample mean or not.
- Here the H0 is “there is no difference” and the H1 is “there is a significant difference”.
- P-value should be less than 0.05 (5%) to accept (failed to reject) the alternate hypothesis.
- To perform one-sample t-test in python we can use scipy.stats.ttest_1samp()
Note: dataset for the following program will be available in https://drive.google.com/file/d/1SD44pF68zADNS-0OuXCn_J_E2andQUV7/view?usp=sharing

- By this result, we can come to the conclusion that the sample data is good and there is no difference between the sample mean and population mean.
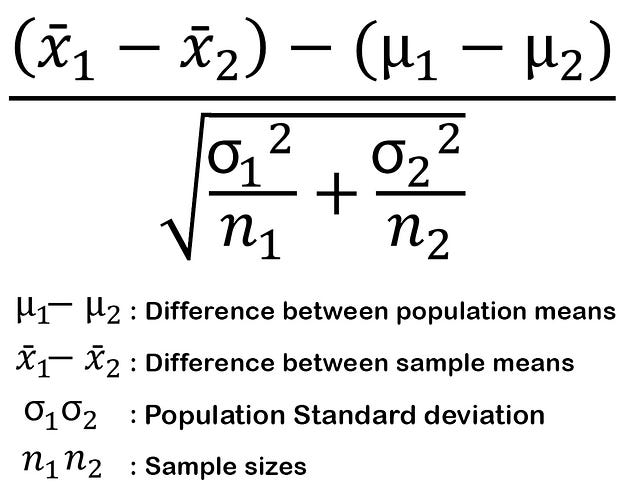
Two-Sample T-Test:
- To check if there is any relationship or association between two independent groups or not.
- Here the H0 is “there is no difference”(association is there) and the H1 is “there is a significant difference” (no association).
- P-value should be less than 0.05 (5%) to accept (failed to reject) the alternate hypothesis.
- To perform two sample t-test in python we can use scipy.stats.ttest_ind()
Note: dataset for the following program will be available in https://drive.google.com/file/d/1SD44pF68zADNS-0OuXCn_J_E2andQUV7/view?usp=sharing

- By this result, we can come to the conclusion that the salesprice of 1st and 2nd floor is not related (no relationship between the tested 2 independent variables).
Paired Sample T-Test:
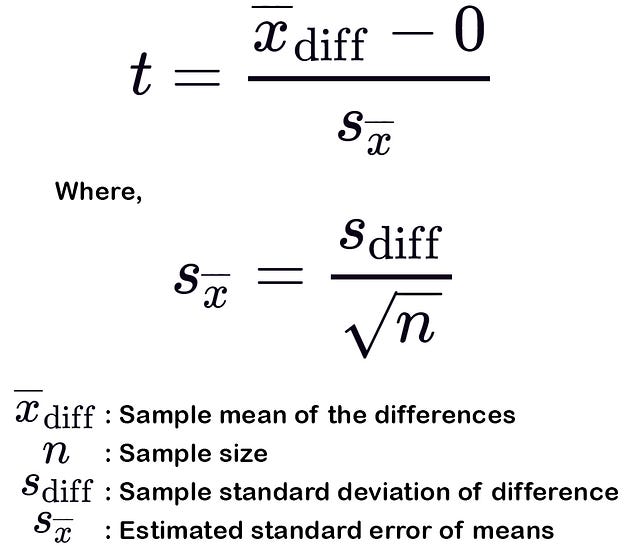
- This test is conducted between to dependent variables to check the difference in data.
- Here the H0 is “there is no difference” and the H1 is “there is a significant difference”.
- To perform paired sample t-test in python we can use scipy.stats.ttest_rel()

- by this result, we can tell that this weight loss program is effective without any doubt.
Z-Test
If the sample size is greater than 30 and population variance is known we should use a z-test. And it is the same as the T-test. Data that is chosen for this z test should have data points that are independent of each other.
One Sample Z-Test:
- Same as one sample T-Test but here we know the population variance and population standard deviation. And the data size should be more that 30.
- To check whether the mean of the population is significantly different from the sample mean or not.
- Here the H0 is “there is no difference” and the H1 is “there is a significant difference”.
- to perform one sample z-test in python we can use statsmodels.stats.weightstats.ztest()

- By this result, we can come to the conclusion that the sample data is good and there is no difference between the sample mean and population mean.
Two Sample Z-Test:
- Same as two sample T-Test but here we know the population variance and population standard deviation. And the data size should be more that 30.
- To check if there is any relationship or association between two independent groups or not.
- Here the H0 is “there is no difference”(association is there) and the H1 is “there is a significant difference” (no association).
- P-value should be less than 0.05 (5%) to accept (failed to reject) the alternate hypothesis.
- To perform two sample z-test in python we can use statsmodels.stats.weightstats.ztest()
- By this result, we can come to the conclusion that the sales price of the 1st and 2nd floor is not related (no relationship between the tested 2 independent variables).
F-Test
Also called ANOVA test.
- Two sample t-test or two sample z-test can able to validate the hypothesis containing only 2 groups at a time. But if we want to perform with more than 2 groups, there this ANOVA test will give its hand to do that.
- ANOVA determines whether the means of 3 or more groups are different or not.
- It uses F-Test to test the equality of the means.
Note: here the degree of freedom is calculated differently for numerator and the denominator. (df for between groups = no. of groups -1 and df for within groups = Total no. of observations - no. of groups)
One-way ANOVA:
- This test is conducted when we have only one independent variable and other as dependent variables.
- This is implemented in scipy by as f_oneway().
Two-way ANOVA:
- We perform one-way ANOVA between one independent and other dependent variables but in this two-way ANOVA, we will perform between two independent variables and two plus groups.
- It’s the extension of one-way ANOVA.
- It will not tell which variable is dominant. if we want to know about that we can perform Post-hoc testing.


sir,
ReplyDeleteWhat are the advantages of version control?
It makes it easier to keep track of your entire project file collection. It enables you to create multiple versions of your project file. and you can access any of your older versions whenever you want.
Deleteits amazing , thank you for yours effort to let readers to know hypothesis
ReplyDeleteThank you for your kind words
DeleteNice.... Thanks for your efforts
ReplyDeletethanks for your appreciation
Delete