
Measure of Central Tendency
- Measure of Spread
- Dependence
Measure of Central Tendency:
Mean → Average of a set of data points.
Median → Middle element of data points which are sorted in ascending order.
Mode → A data point that appeared the most number of times out of a set of data points.
Measure of Spread:
Standard Deviation (SD) → Average distance between mean and each data points.
Variance → Measure of how far each value in the data set is from the mean (Square of SD).
Range → Maximum value minus Minimum value from a set of data points.
Percentile → Representation of position of a value in a dataset (dataset should be sorted in ascending).
Quartiles (Q1, Q2, Q3) → Divide a complete data set into 4 Quarters (dataset should be sorted in ascending). Q1, Q2, and Q3 are the 25, 50, and 75 percentile of the dataset. Q2 is the median value of the dataset (fig 1).

fig 1: Quartiles and Percentiles
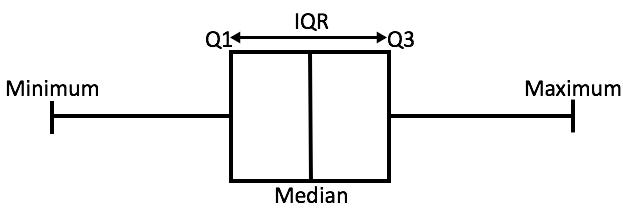
Interquartile Range (IQR) → Q3 - Q1
fig 2: Boxplot
Outliers → additional observations below MINIMUM and above MAXIMUM are Outliers. There are many ways to mathematically represent or define outliers. One such method is using IQR.
Skewness:
Measure of asymmetry of the probability distribution of the dataset.
- Positive Skewness
- Negative Skewness
- Undefined (No Skewness)
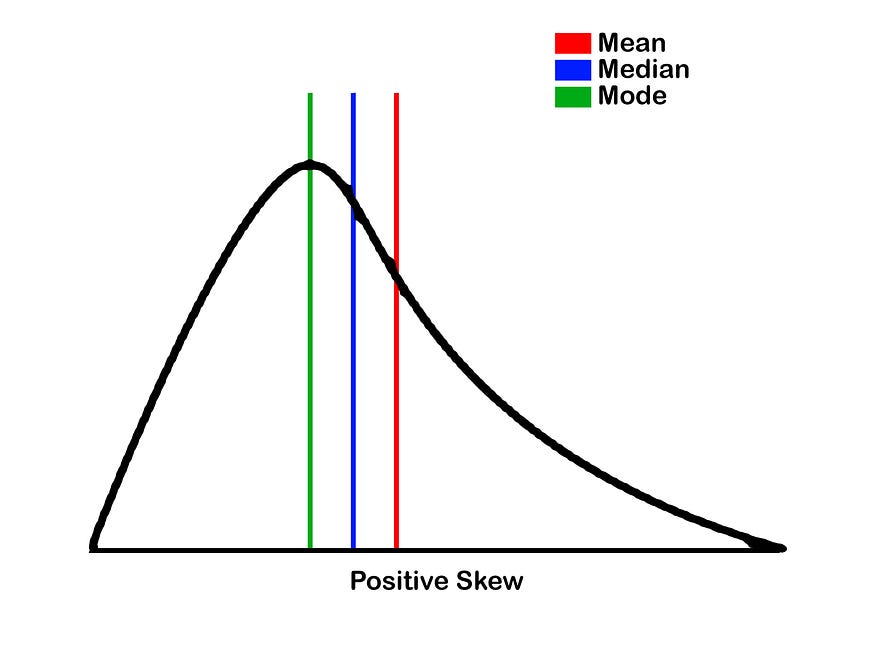
Positive Skewness → Right skewed. Tail on the right side of the distribution longer than the left side. Mean is always greater than the median and the median is always greater than the mode.
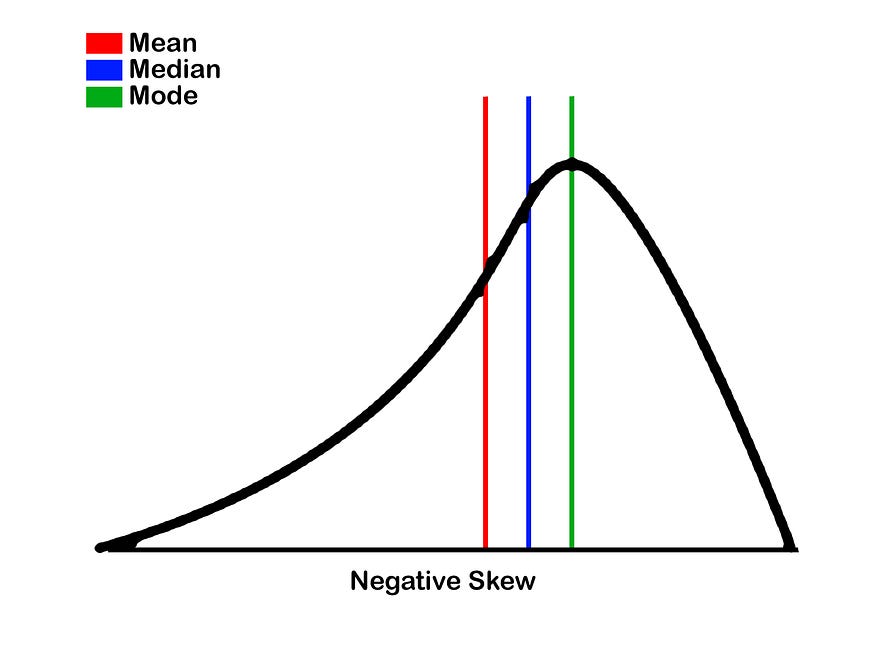
Negative Skewness → Left skewed. Tail on the left side of the distribution longer than right side. Mean is always lesser than the median and the median is always lesser than the mode.
No Skewness → Mean, Median and Mode are equal. One side of the curve is like a mirror image of other side.
Note: If skewness is less than -1 or greater than 1, the distribution is highly skewed. If skewness is between -1 and -0.5 or between 0.5 and 1, the distribution is moderately skewed. If skewness is between -0.5 and 0.5, the distribution is approximately symmetric.
Kurtosis (k)→ Related to normal distribution, kurtosis is a measure of tail of probability distribution.
- Leptokurtic → Thick tail (k>0)
- Platykurtic → Thin tail (k<0)
Note: Skewness is used to measure the degree of symmetricity whereas kurtosis is used to measure the degree of presence of outliers in distribution.
Dependence:
Correlation (+1.0 t0 -1.0) → Any statistical relationship between two random variables or bivariate data.
- Positive correlation
- Negative correlation
- No correlation
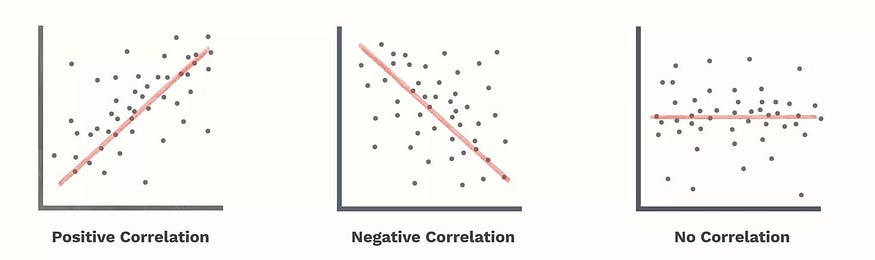
Positive Correlation (0 to 1) → If one variable gets larger other variable also gets larger. A correlation coefficient of 1 means that for every positive increase of 1 in one variable, there is a positive increase of 1 in the other
Negative Correlation (-1 to 0) → If one variable gets larger other variable gets smaller. A correlation coefficient of -1 means that for every positive increase of 1 in one variable, there is a negative decrease of 1 in the other.
No Correlation (0) → One variable’s change will not affect other variable. No relation ship between 2 variables. Zero means that for every increase, there isn’t a positive or negative increase. The two just aren’t related.
Thank you
Ram Thiagu
Linkedin→ https://www.linkedin.com/in/ram-thiagu/


Informative...great work
ReplyDeleteThank You
DeleteNice.... Very informative
ReplyDeletethank you
Delete